Inference + Review
Lecture 23
Dr. Elijah Meyer + Konnie Huang
Duke University
STA 199 - Fall 2022
November 16th, 2022
Checklist
– Clone exam2-review - This is the part of ae-21 that we didn’t finish with end review questions
Announcements
– Exam 2 on Thursday
Released at noon
No slack or TA office hours
Don’t cheat
Due Monday at 2
– All keys are posted (or will be posted before noon tomorrow)
Grading Questions
– EC for Exam 1 is not in
– Lowest HW is dropped
– Lowest Lab is dropped
Study Tips - Variables
– Identify variables
Categorical vs Quantitative
Explanatory vs Response
Models by Variable Type
– Simple Linear Regression: 1 Quantitative Response; 1 Categorical or Quantitative Explanatory Variable
– Mulitple Linear Regression: 1 Quantitative Response; 2 or more Categorical or Quantitative Explanatory Variables
– Logistic Regression: 1 Categorical Response (Binary); 1 or more Categorical or Quantitative Explanatory Variables
Study Tips - Make your own guide
Reference Examples at bottom of help page, AEs, HWs, and Labs.
Exam Format
– Short response questions
– Application questions
– Extension questions
Goals
– Review
Simpson’s Paradox
P-value interpretation
– Compare two means, and do a bootstrap interval
– Prediction and bootstrap interval for the slope
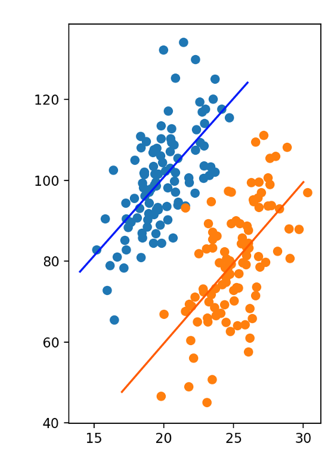
Simpson’s Paradox
Describe the relationships observed in the scatter plot. Comment on: Form; Strength; Direction.

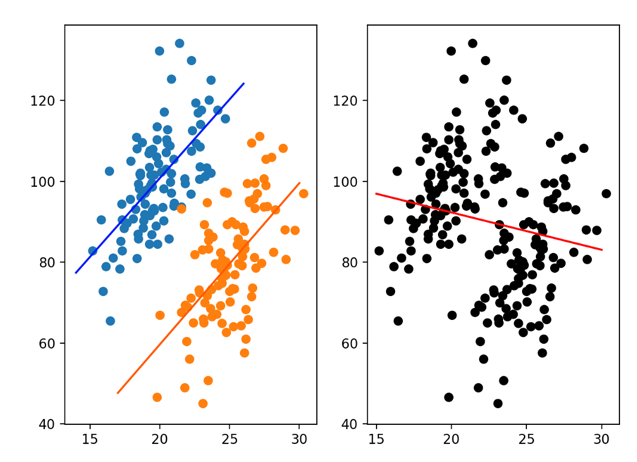
Simpson’s Paradox - Same Data… Ungrouped
What about now?

… a trend appears in groups of data but disappears or reverses when the groups are combined.
p-values
– What is it?
– How do we interpret it?
p-values
– Probability
– of observing what we did or something more extreme
– given \(H_O\) = T

Example
Airbnb Example
– Response variable: price per guest
– Assume Ho: \(\mu\) = 60
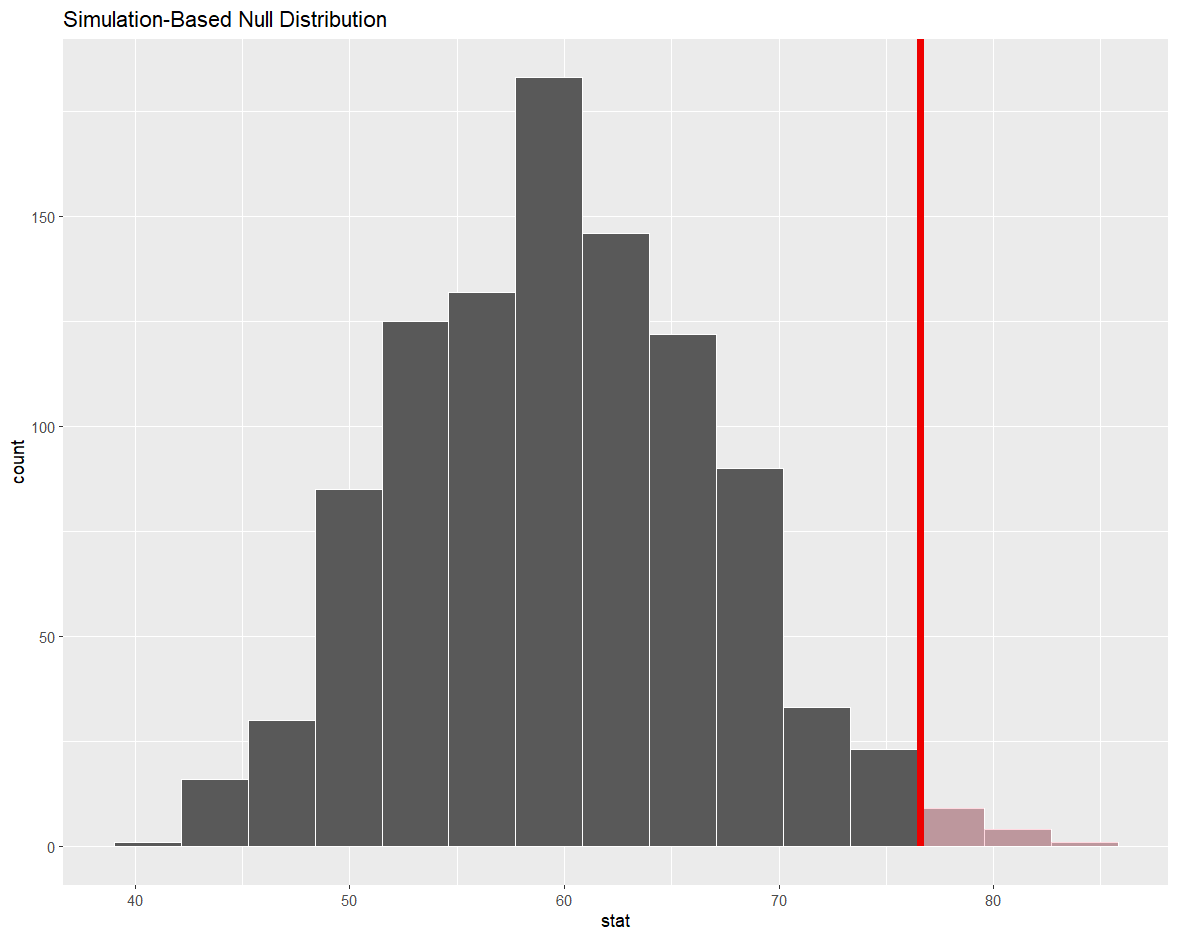
– p-value ~ 0.14

Example

The probability of observing a mean price per guest of 76.6 dollars, or something larger, assuming that the true mean price per guest of Ashville, NC Airbnbs in June 2020 was 60 dollars is equal to ~ 0.14.
exam2-review
