Spatial Data
Looking Forward
Dr. Elijah Meyer + Konnie Huang
Duke University
STA 199 - Fall 2022
December 5th, 2022
Checklist
– Clone LookingForward1
– If a tab comes up to install packages, do so.
– Click install in the tab or use install.packages(“package.name”)
Announcements
– Project presentations due Thursday
– One more peer review
– Fill out presentation info (link on Sakai)
– ^ This is also where you will find the link to review presentations
– Please include team(#) information on title slide
Announcements
– Exam 2 grades are published
– If you missed points for only stating hypotheses in Q4 or Q5, submit a regrade request
– Exam retake repos are published
Goals
– What does statistics / data science look like outside of university?
– Overview of Spatial Statistics
The best thing about being a statistician is that you get to play in everyone’s backyard
– Tukey


Atrium
– Perform EDA and data analysis using Python and R (in a reproducible format)
– Build and productionize models
– Manage cross functional teams with business SMEs that validate model insights, data experts who assist in managing/integrating data, and communicate progress/insights to executive stakeholders
– Communicate results to a broad set of non-technical people (typically in tools like Powerpoint/Slides as well as in reproducible docs like RMarkdown/Jupyter Notebooks)
– Build analytics dashboards in tools like Tableau or PowerBI to display data
— https://atrium.ai/about/
USGS
– development of new statistical techniques to analyze various data types
– development of products to communicate those techniques to wildlife managers and facilitate their implementation (this is a pretty big one that occupies a lot of my time
– development of software for analysis and data visualization
– use of version control software
– use of probabilistic programming languages like stan, nimble, and jags
– writing up samplers in C++ and Julia (data science kids might get a kick out of this, happy to share some julia code if that is the case)
– a big part of the job is also communicating results to government folks that don’t know anything about statistics
USGS
https://christianstratton.shinyapps.io/batapp/?_ga=2.176377317.1341335816.1666368887-1922592585.1666368887
Closing Thoughts
– We live in a world of big data
– These are necessary skills that will follow you into your career, even if you are not specifically a data scientist or statistician
Looking Forward Topic 1: Spatial Statistics
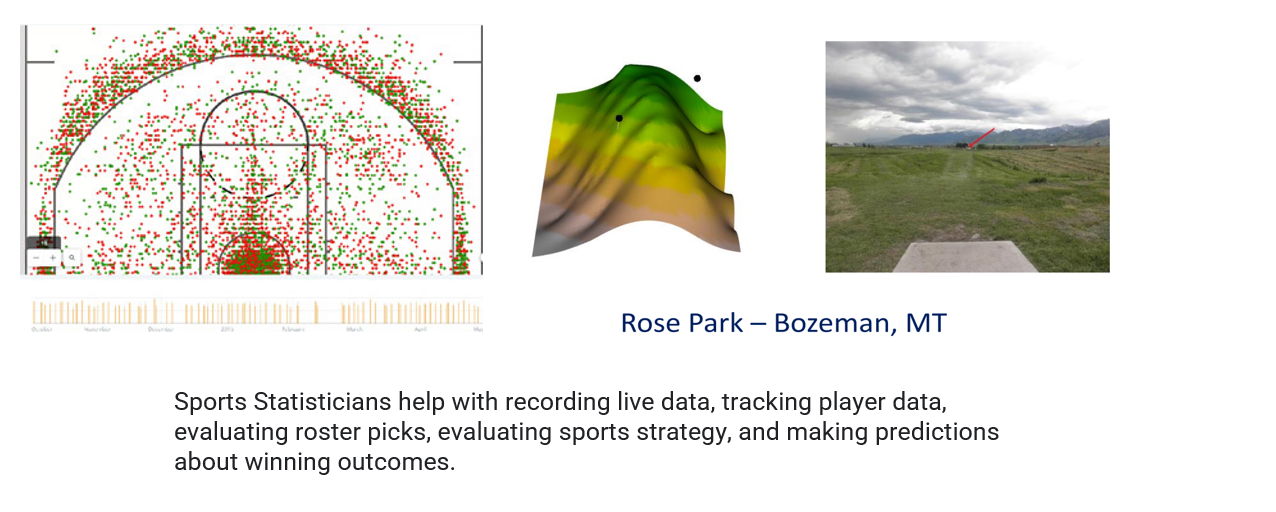
Spatial Modeling Overview
Researchers in many fields are faced with analyzing data with a spatial component. These analyses typically include:
- modeling trends and correlation structures
- estimation of underlying model parameters
- hypothesis testing or model comparision
- prediction of observations at unobserved times or locations
Spatial Data Viz Tools
There are many tools for creating spatial figures (GIS software, Tableau, etc…), but we will exclusively use R and the wide range of packages within it.
In particular, we will use:
ggplot2leafletand more…
LookingForward1
