Lecture 11 - Data Ethics
Lecture 10
Dr. Elijah Meyer + Konnie Huang
Duke University
STA 199 - Fall 2022
October 3, 2022
Checklist
– Clone exam data ethics
– Breath a little! The exam is over :)
Announcements
– Exams graded by Friday
– Groups are coming
Goals
– Understand causality
– Understand how to improve graphs
axes
scales
uncertainty
– Think about data
– Be a skeptic
– Practice in R
Causality
– What questions do you have?
– What do you wonder?
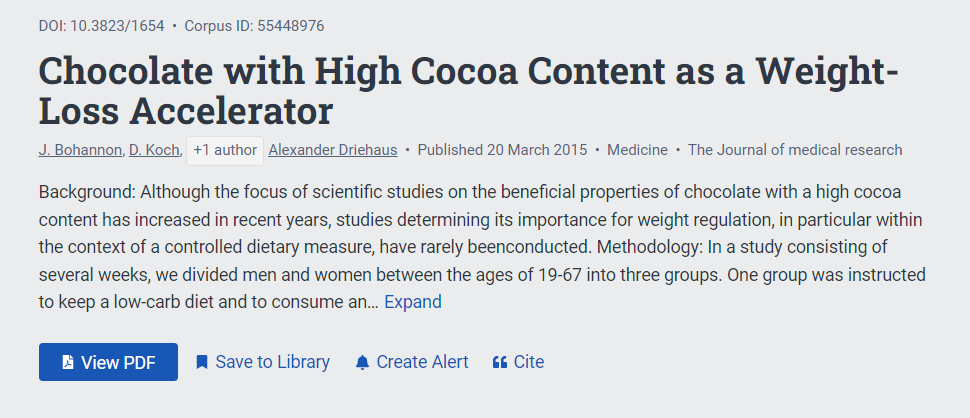
The Study
– 5 men and 11 women showed up, aged 19 to 67.
– Frank randomly assigned the subjects to one of three diet groups. One group followed a low-carbohydrate diet. Another followed the same low-carb diet plus a daily 1.5 oz. bar of dark chocolate. And the rest, a control group, were instructed to make no changes to their current diet.
– They weighed themselves each morning for 21 days, and the study finished with a final round of questionnaires and blood tests.
The Great Chocolate Hoak
“If you measure a large number of things about a small number of people, you are almost guaranteed to get a”statistically significant” result. Our study included 18 different measurements—weight, cholesterol, sodium, blood protein levels, sleep quality, well-being, etc.—from 15 people. . . .”
“It was, in fact, a fairly typical study for the field of diet research. Which is to say: It was terrible science. The results are meaningless, and the health claims that the media blasted out to millions of people around the world are utterly unfounded.”

Original study
Moore, Steven C., et al. “Association of leisure-time physical activity with risk of 26 types of cancer in 1.44 million adults.” JAMA internal medicine 176.6 (2016): 816-825.
- Volunteers were asked about their physical activity level over the preceding year.
- Half exercised less than about 150 minutes per week, half exercised more.
- Compared to the bottom 10% of exercisers, the top 10% had lower rates of esophageal, liver, lung, endometrial, colon, and breast cancer.
- Researchers found no association between exercising and 13 other cancers (e.g. pancreatic, ovarian, and brain).

The Takeaway
– Be a skeptic
– Ask questions
– Let the data tell the story, don’t tell the data for the story
– Most studies should not claim causality
Telling a story
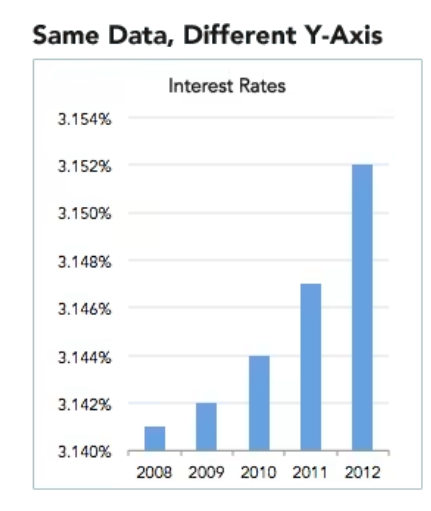
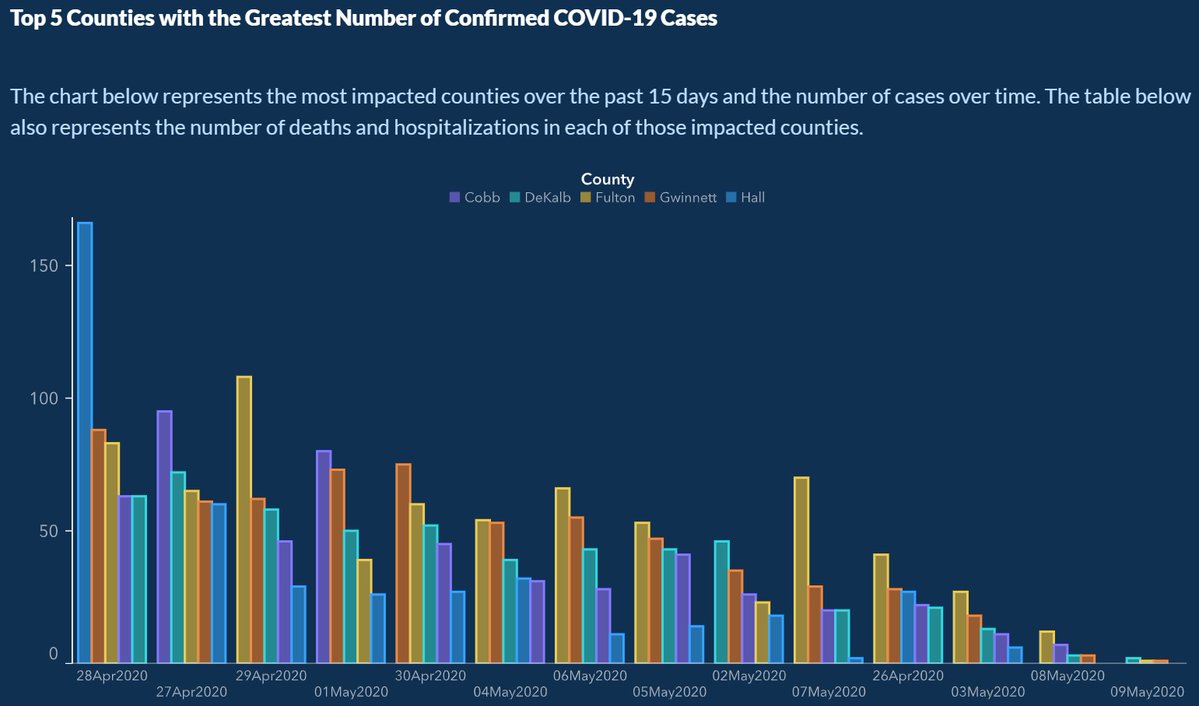
– What does this graph represent?
– What are the story of these data?
– Is the graph misleading?
– How could you improve this graph?
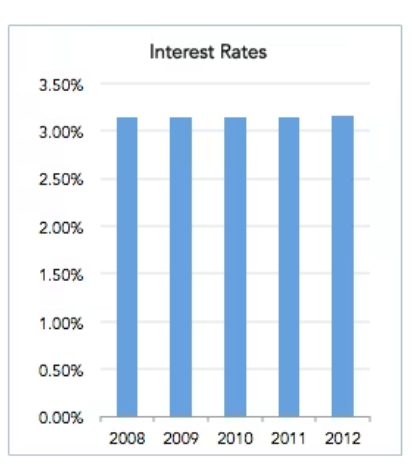
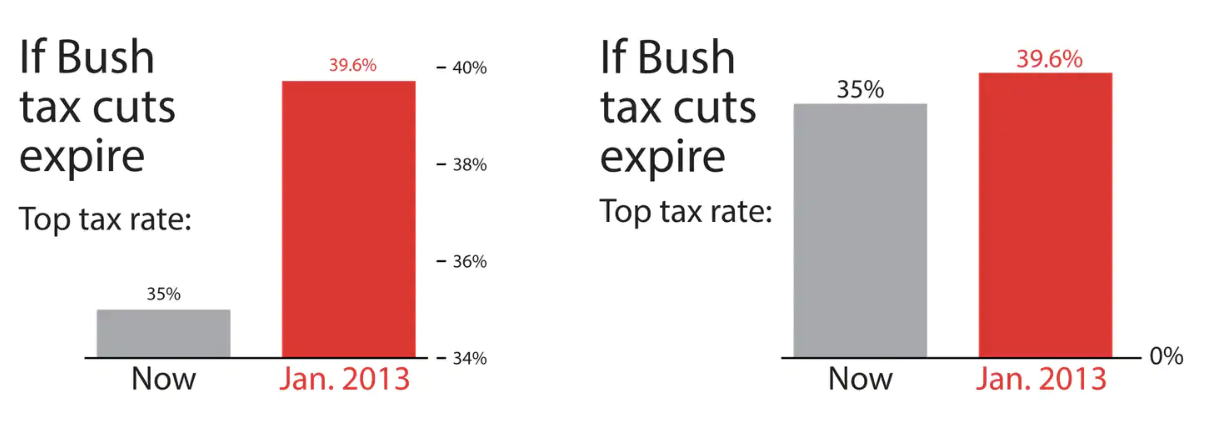
How woul you fix this graph?
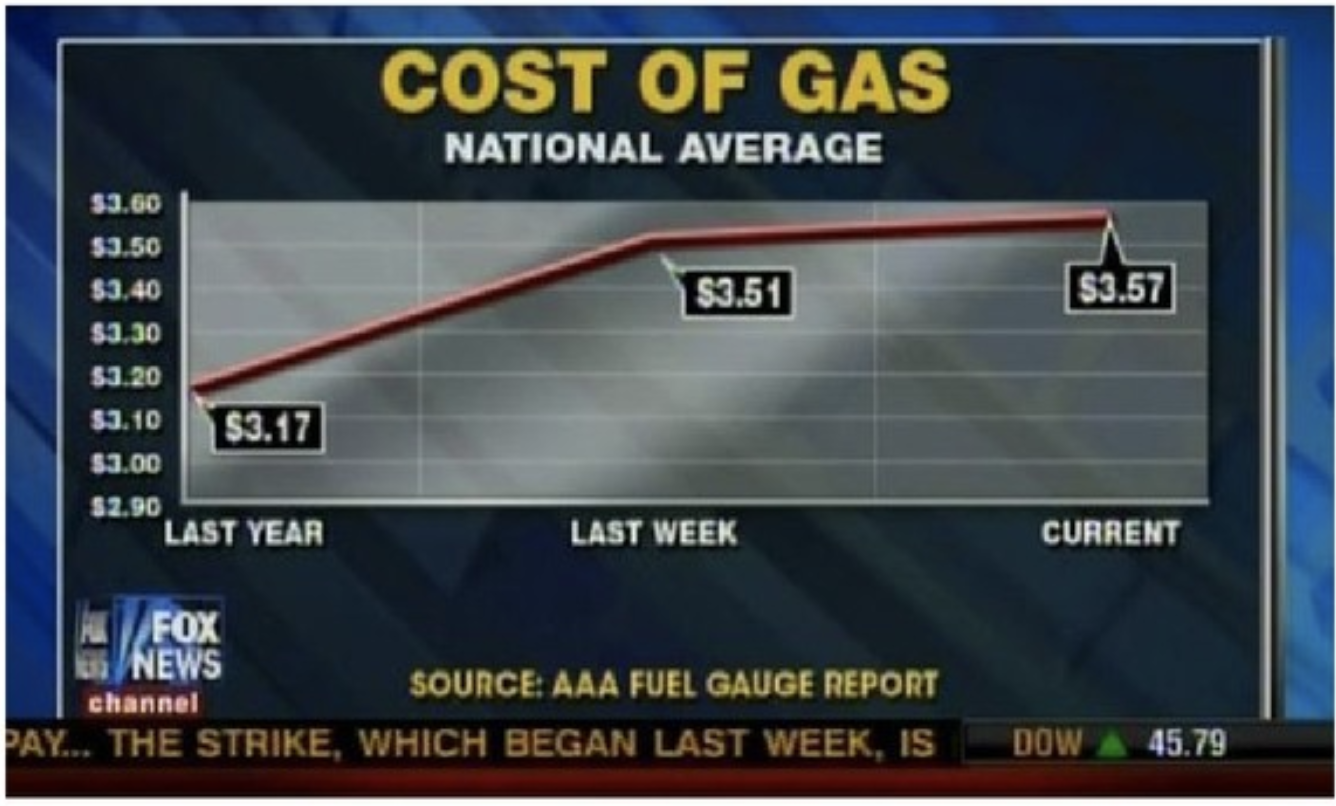

What’s wrong with this graph?
Visualising uncertainty
What is uncertainty?
– “How sure are you of your conclusions?”
What is uncertainty?
There are many reasons why a data analysis might still leave us in a position of uncertainty
– We don’t have population data
– Measurement error
– Reporting error
Quick Example
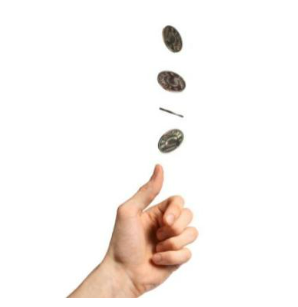
- Flip 1: Heads
- Flip 2: Heads
- Flip 3: Tails
- Flip 4: Heads
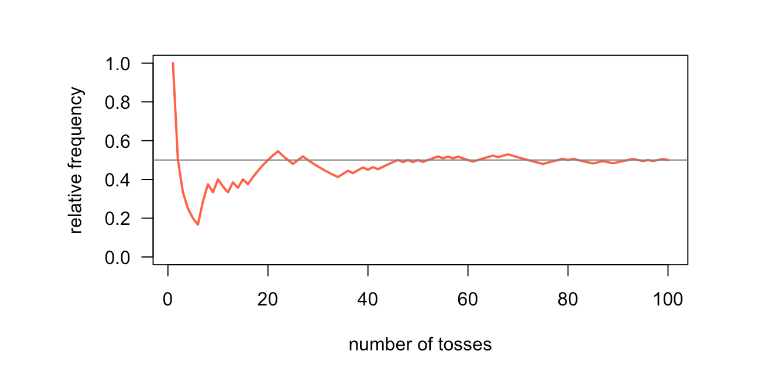
Suppose a researcher was interested in how diet impacted chicken weight? They assigned 5 chickens to 1 of 4 different diets. Here are the reported median weights of the 4 groups of chickens:
– Diet 1: 160 grams
– Diet 2: 225 grams
– Diet 3: 280 grams
– Diet 4: 245 grams
- So Diet 4 causes heavier chickens? Other reasons?
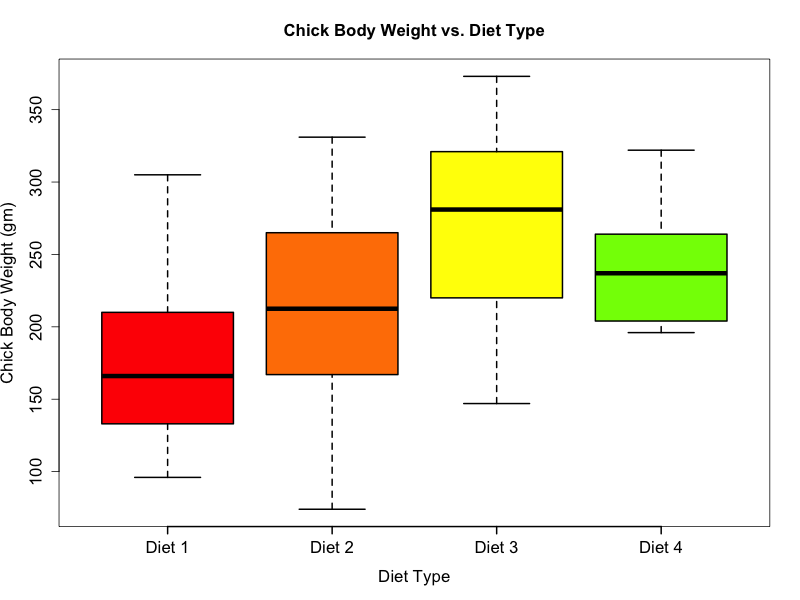

So the answer is No! …. No?

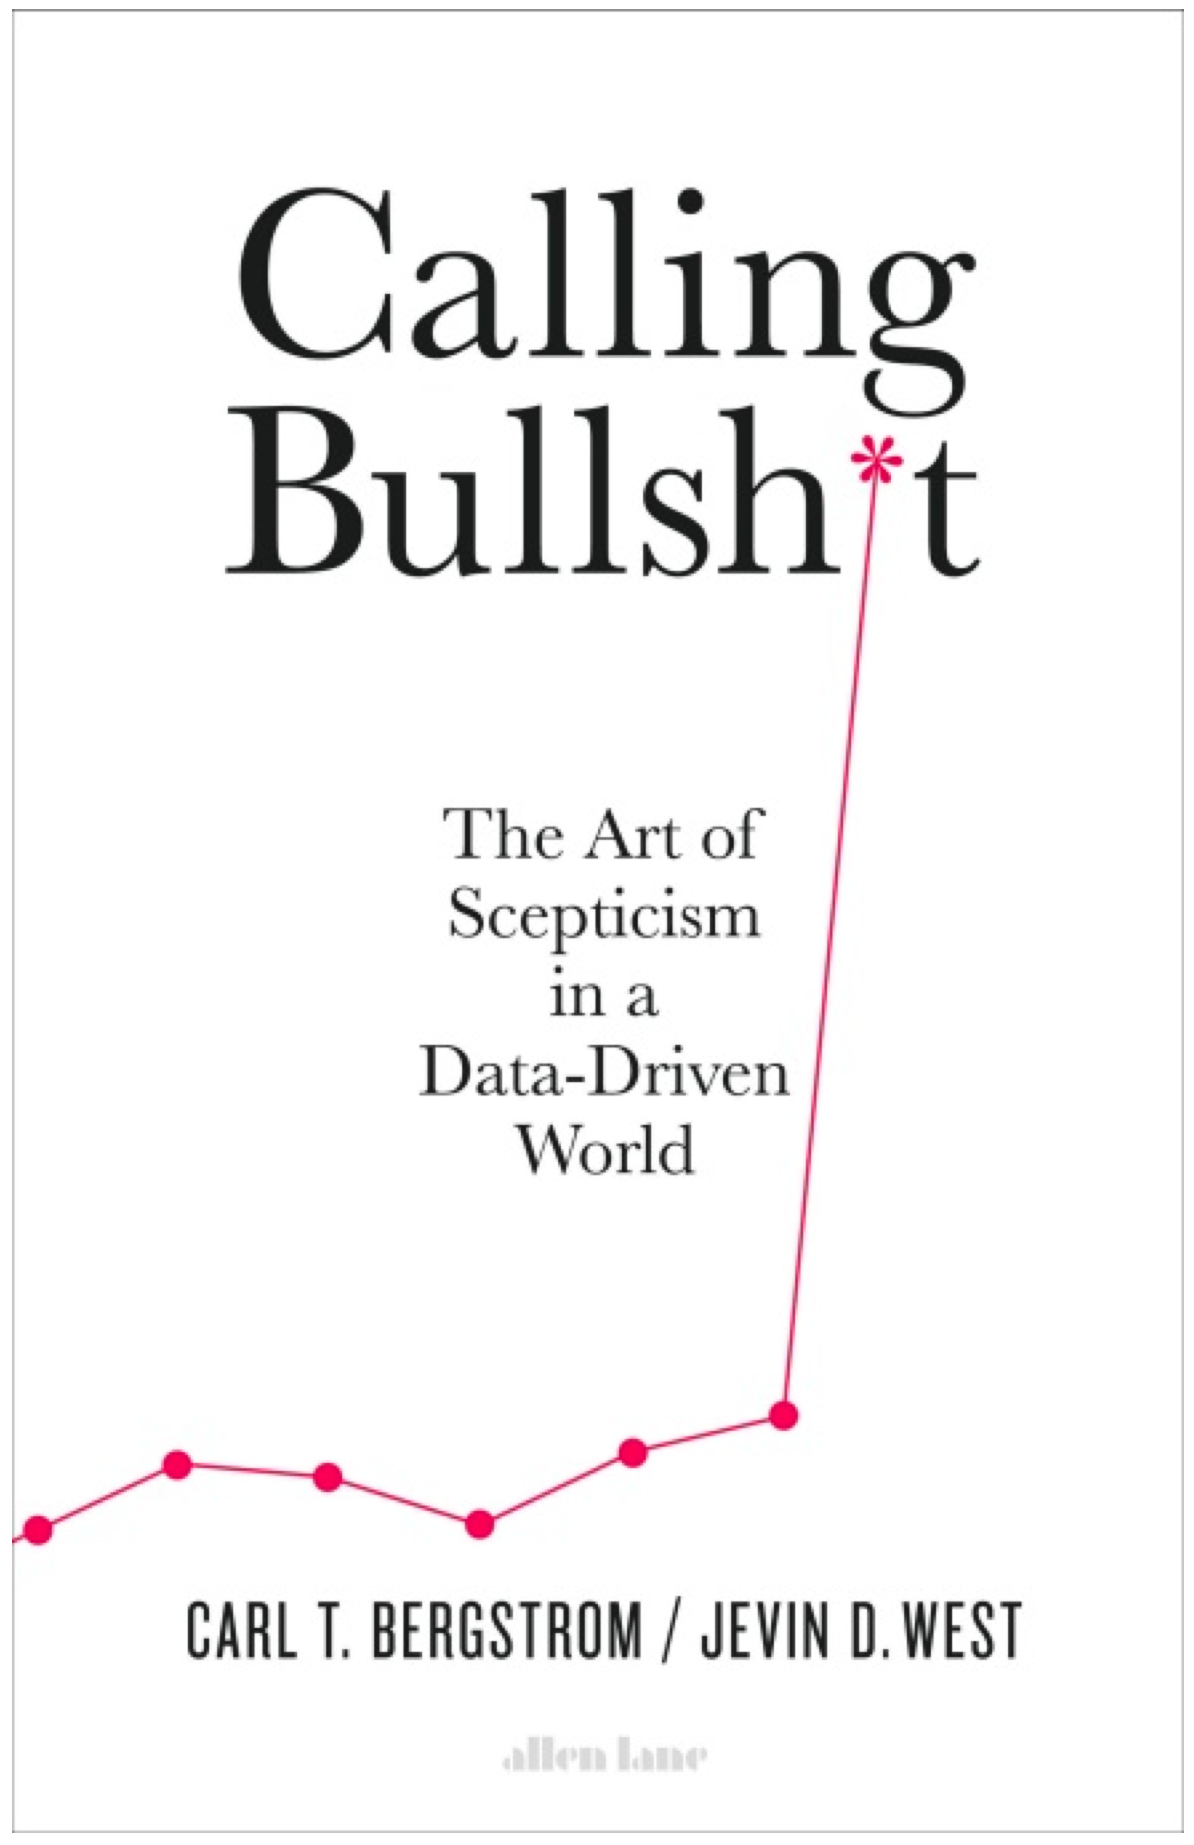
The Art of Skepticism in a Data-Driven World
by Carl Bergstrom and Jevin West
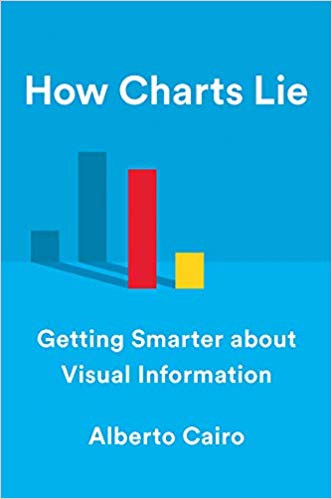
Getting Smarter about Visual Information
by Alberto Cairo
ae-10 Data Ethics
For Next Time: Don’t do this
“It looks like we can scrape student ID and email information. What type of project can we do with this?”
