Grammer of Graphics
Lecture 3
Duke University
STA 199 - Fall 2022
September 5th, 2022
Reading Highlights
– Sometimes you’ll run the code and nothing happens. Check the left-hand of your console: if it’s a +, it means that R doesn’t think you’ve typed a complete expression and it’s waiting for you to finish it.

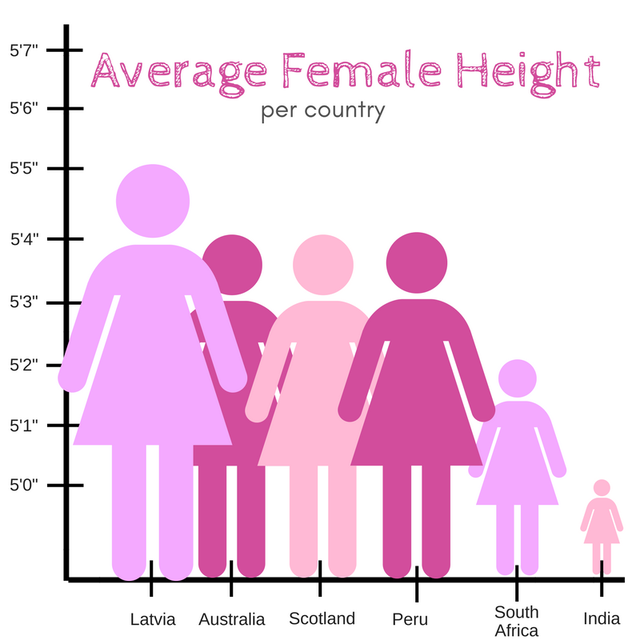
Examining data visualization
Discuss the following for the visualization.
– What is the visualization trying to show?
– What is effective, i.e. what is done well?
– What is ineffective, i.e. what could be improved?
– What are you curious about after looking at the visualization?
04:00
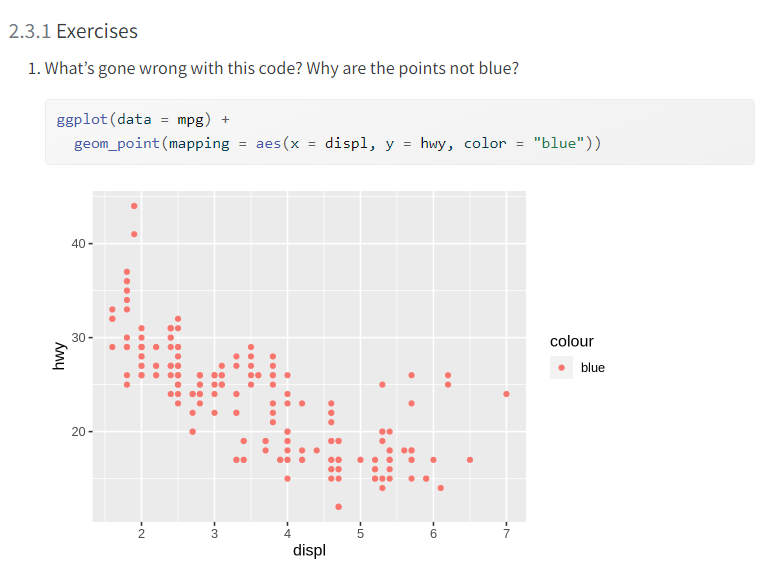
Exercises 2.3.1
Recap of AE
– Construct plots with ggplot().
– Layers of ggplots are separated by +s.
– The formula is (almost) always as follows:
– Aesthetic attributes of a geometries (color, size, transparency, etc.) can be mapped to variables in the data or set by the user.
– Use facet_wrap() when faceting (creating small multiples) by one variable and facet_grid() when faceting by two variables.