Opinion articles in The Chronicle
Part 1 - Data scraping
This will be done in the chronicle.R R script. Save the resulting data frame in the data folder.
Suggested scraping code can be found here.
Part 2 - Data analysis
Let’s start by loading the packages we will need:
-
Your turn (1 minute): Load the data you saved into the
datafolder and name itchronicle.
chronicle <- read_csv("data/chronicle.csv")- Your turn (3 minutes): Who are the most prolific authors of the 100 most recent opinion articles in The Chronicle?
chronicle |>
  count(author, sort = TRUE)
# A tibble: 69 × 2
author n
<chr> <int>
1 Anthony Salgado 3
2 Billy Cao 3
3 Community Editorial Board 3
4 Heidi Smith 3
5 Linda Cao 3
6 Luke A. Powery 3
7 Monday Monday 3
8 Sonia Green 3
9 Viktoria Wulff-Andersen 3
10 Abdel Shehata 2
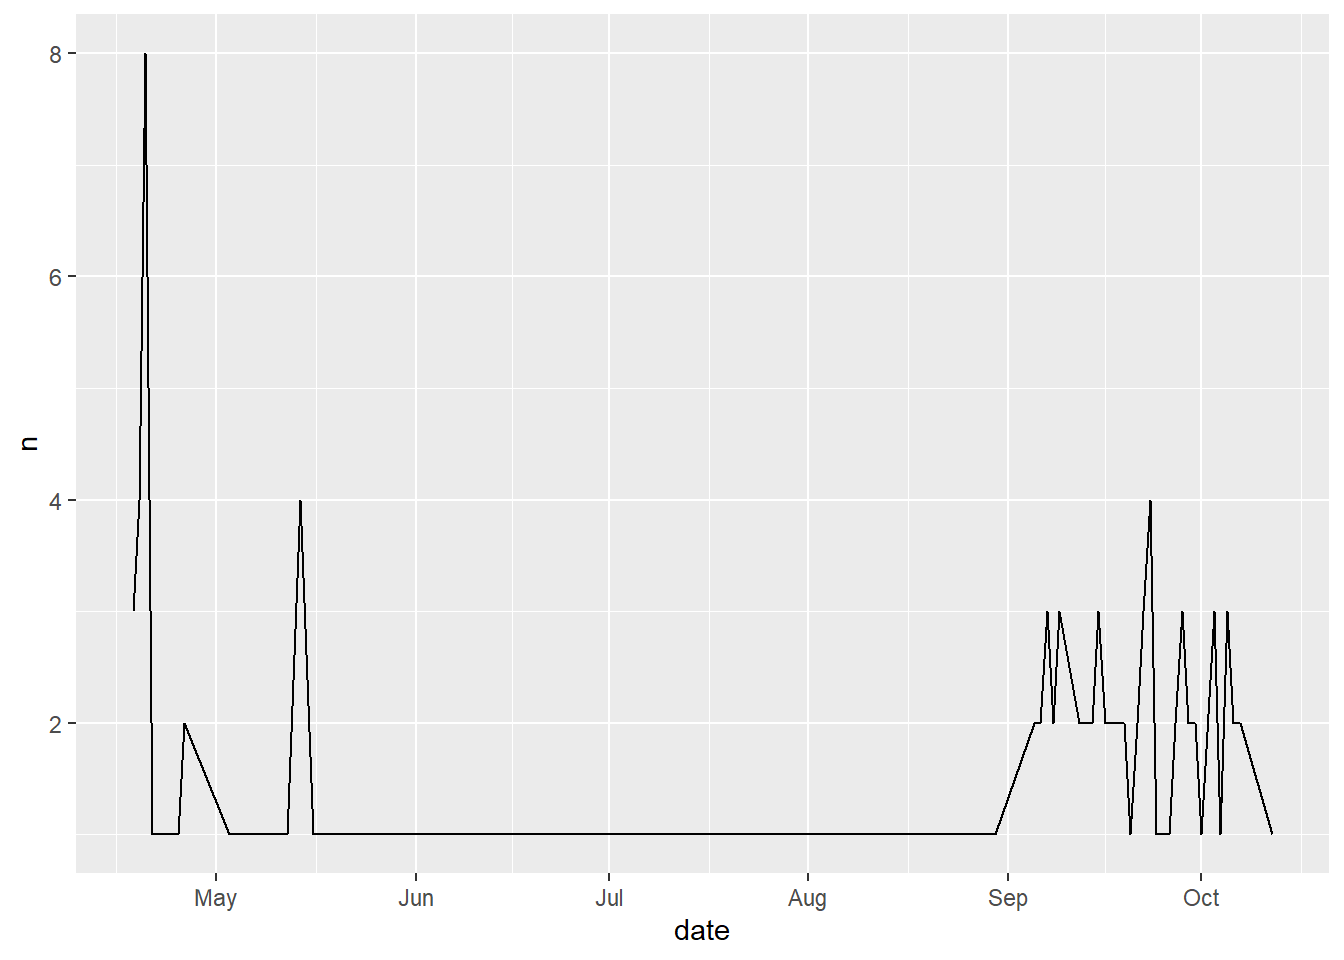
# … with 59 more rows- Demo: Draw a line plot of the number of opinion articles published per day in The Chronicle.
- Demo: What percent of the most recent 100 opinion articles in The Chronicle mention “climate” in their title?
chronicle |>
  mutate(
    title = str_to_lower(title),
    climate = if_else(str_detect(title, "climate"), "mentioned", "not mentioned")
    ) |>
  count(climate) |>
  mutate(prop = n / sum(n))
# A tibble: 2 × 3
climate n prop
<chr> <int> <dbl>
1 mentioned 3 0.03
2 not mentioned 97 0.97- Your turn (5 minutes): What percent of the most recent 100 opinion articles in The Chronicle mention “climate” in their title or abstract?
chronicle |>
  mutate(
    title = str_to_lower(title),
    abstract = str_to_lower(abstract),
    climate = if_else(
      str_detect(title, "climate") | str_detect(abstract, "climate"),
      "mentioned",
      "not mentioned"
      )
    ) |>
  count(climate) |>
  mutate(prop = n / sum(n))
# A tibble: 2 × 3
climate n prop
<chr> <int> <dbl>
1 mentioned 4 0.04
2 not mentioned 96 0.96- Time permitting: Come up with another question and try to answer it using the data.
# add code here